The Engineering Leadership Report 2026
How engineering leadership is evolving, and what it means for the future of the role.
In partnership with

Software engineering leadership is operating under huge pressure.
Engineering leaders are being asked to do more – technically, strategically, and managerially – as organizations flatten and AI reshapes how code gets written, reviewed, and shipped.
Based on 600 responses, the data tells a story of an industry under sustained and compounding forces.
What’s inside
- Analysis of 600 engineering leaders’ survey responses
- How engineering leadership is evolving
- A glimpse into the future of engineering leadership

Key takeaways


Download the report
Report findings
Organizations are changing, not falling apart
Re-organization of team and division structures represents the most common significant change, cited by 67% of respondents.
Leadership changes affected 45% of respondents, while hiring freezes (35%) and layoffs (33%) were reported at similar rates to 2025.
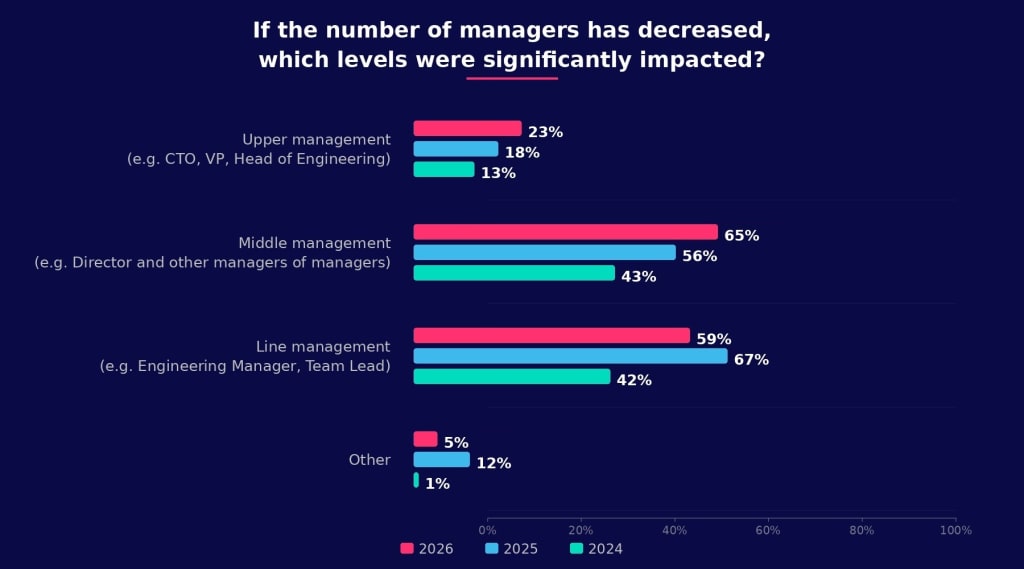
The management layer picture is more nuanced, with 22% of respondents reporting a decline in managerial jobs and 19% seeing an increase in 2026.
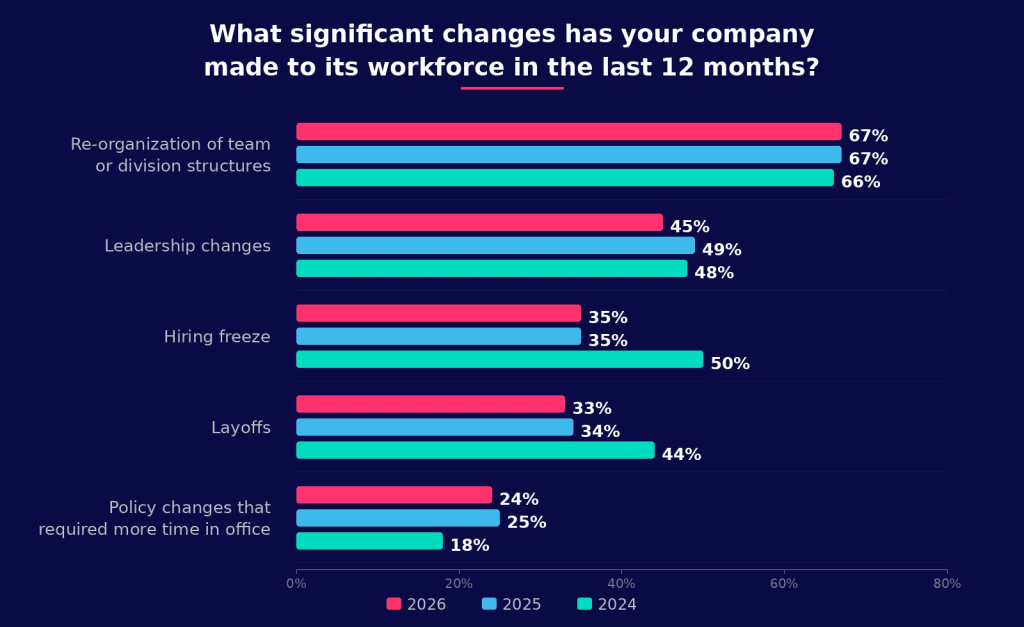
Among respondents whose organizations saw a decrease in manager roles, the impact was concentrated at line management (59%) and middle management (65%) level.
However, a notable shift is occurring at the top:
23% of those reporting manager decreases said
upper management has been significantly
impacted, up from 18% in 2025 and 13% in 2024.
When organizations are hiring managers, the focus
remains on line (67%) and middle management
(50%).
The engineering leader’s role is expanding
Engineering leaders are being pulled in more directions simultaneously.
Scope and area of responsibility increased for 63% of respondents, consistent with previous years. Technical work is returning to the leadership agenda in a way that would have surprised many observers just two years ago.
More than a third (37%) of respondents say their hands-on technical responsibilities have increased in the last 12 months, compared to just 25% in 2025.
Nearly half of respondents (48%) say they spend more time on technical-related tasks than management-related ones, up from 42% in 2025.

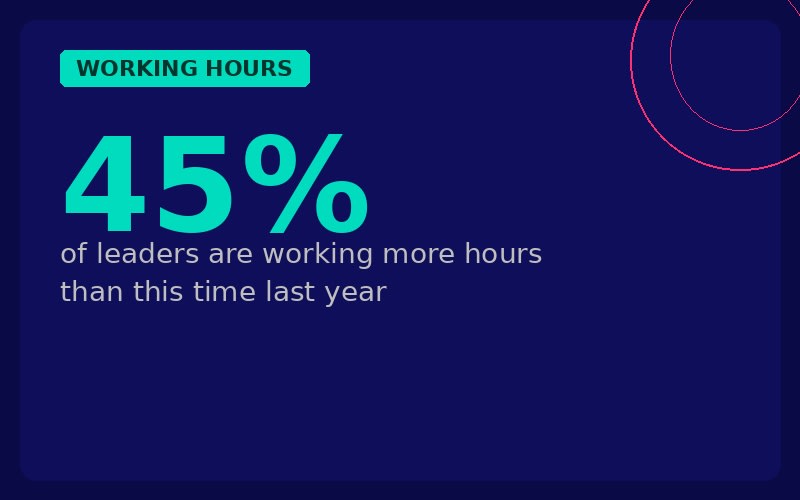
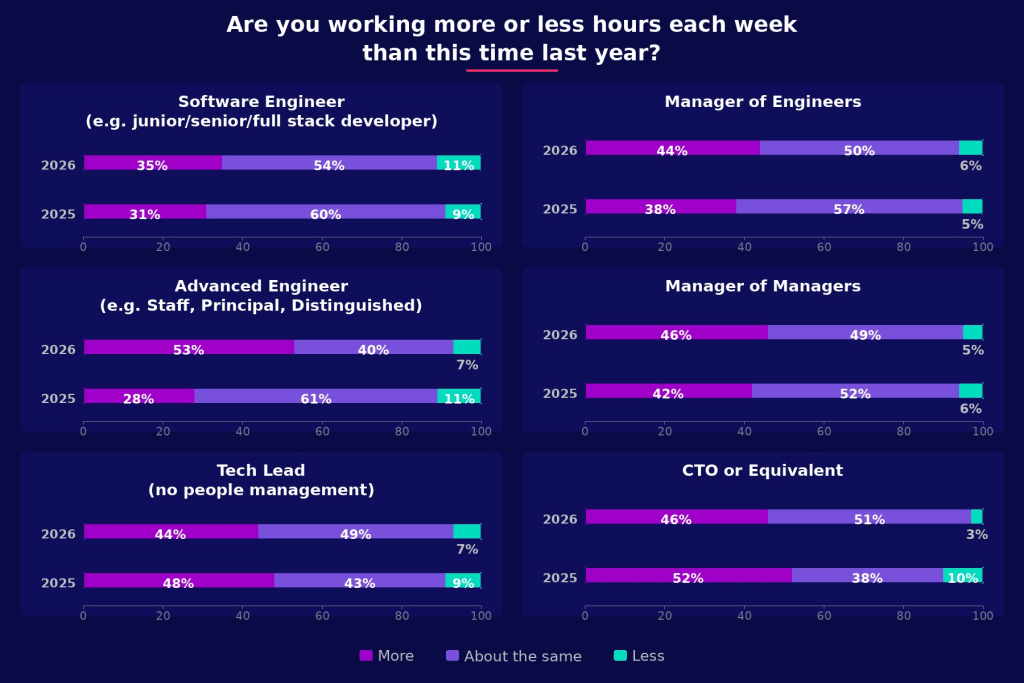
Just under half (45%) of respondents report working more hours each week than at this point last year, up from 38% in 2025 and 35% in 2024.
The biggest increase was among advanced engineers, 53% in 2026 compared to 28% in 2025, followed by managers of engineers (44% vs. 38%)
and managers of managers (46% vs. 42%).
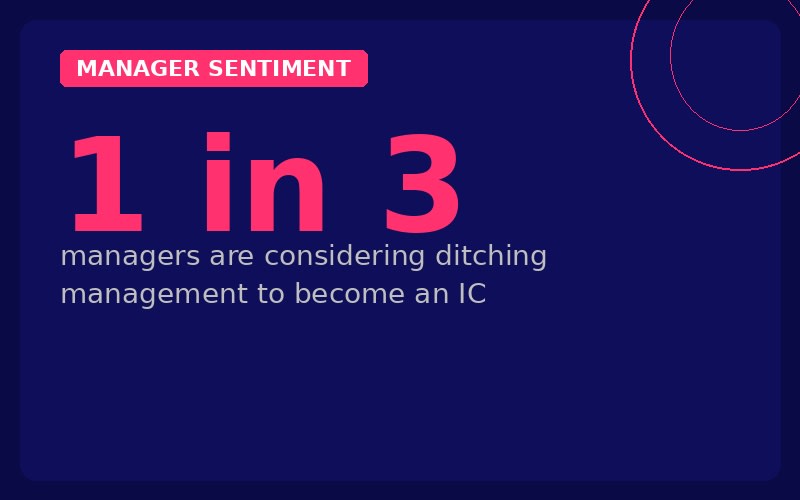
A third (32%) of those in managerial positions are currently considering a return to individual contributor (IC) roles, up from 24% in 2025.
Managers of managers (29%) are less likely to transition back to IC roles compared with managers of engineers and CTOs (both 34%).
“Now more than ever, leaders must keep their technical skills sharp in order to understand, adopt, measure, and validate their team’s usage of AI tools,” says engineering leader Vaidehi Joshi.
AI adoption is widespread but poorly measured
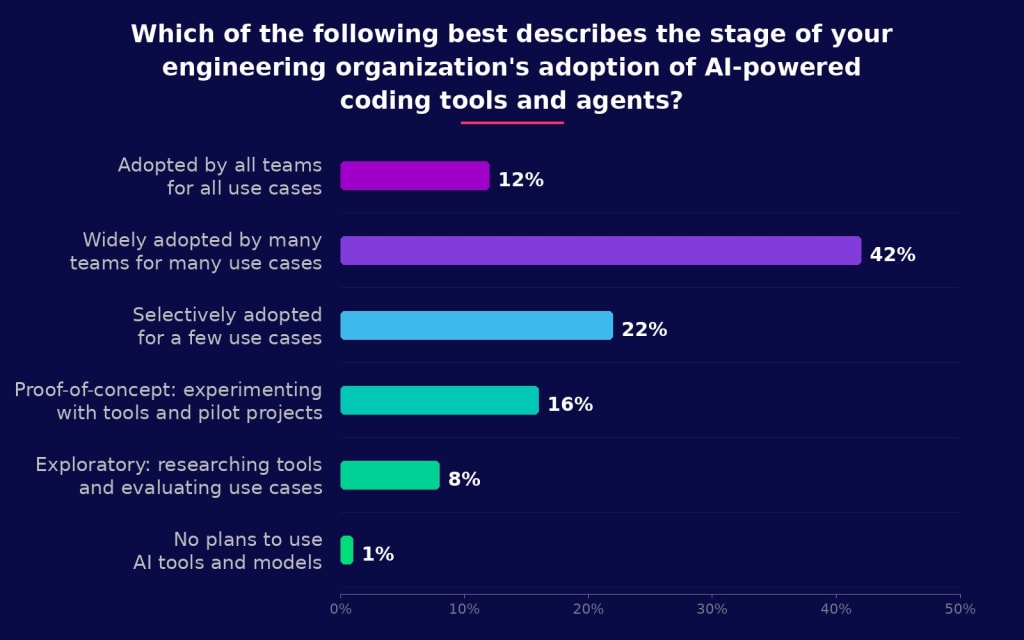
AI-coding tools and agents are now mainstream in engineering organizations.
More than half (54%) of respondents say their organization has widely or totally adopted these tools. Only 1% say they have no plans to use them at all.
For the first time in this study’s three-year history, internal AI adoption (77%) has overtaken feature development (71%) as the leading engineering priority.
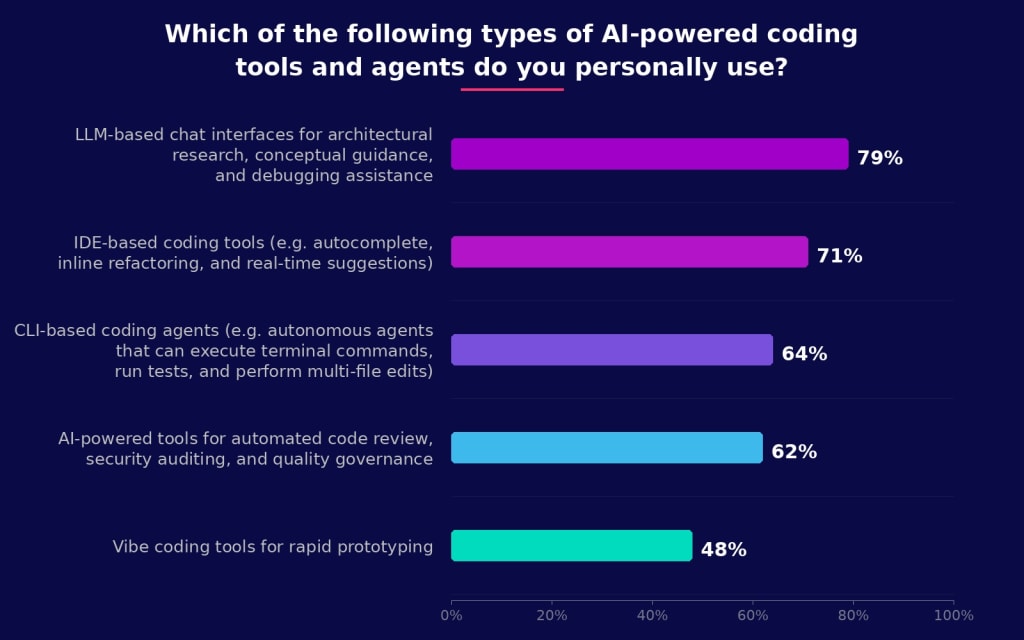
The tools being used reveal where AI adoption currently sits in practice.
LLM-based chat interfaces for architectural research and debugging are the most widely used, cited by 79% of respondents. IDE-based coding tools with autocomplete and inline suggestions follow at 71%.
Vibe coding tools for rapid prototyping are
used by 48% of respondents overall, and 66%
of CTOs personally.
Measuring the impact of AI systems, however, remains a significant gap.
Employee feedback is the most commonly used metric for assessing AI’s impact on productivity (63%), but it is an imprecise instrument.
More rigorous metrics are used by only around a fifth of organizations.
“Self-reported productivity has never been the best signal,” says James Stanier, CTO at Nordhealth. “It should be paired with other signals, like the traditional DORA metrics (are we actually going faster?) and token spend (who is using the tools the most?).”

AI concerns, risks, and the
junior developer crisis
For all the momentum behind adoption of AI-powered coding tools and agents, the concerns among engineering leaders are substantial and deserve serious attention.
Impact on code maintainability tops the list of concerns at 73%, closely followed by the quality of AI outputs at 71%.
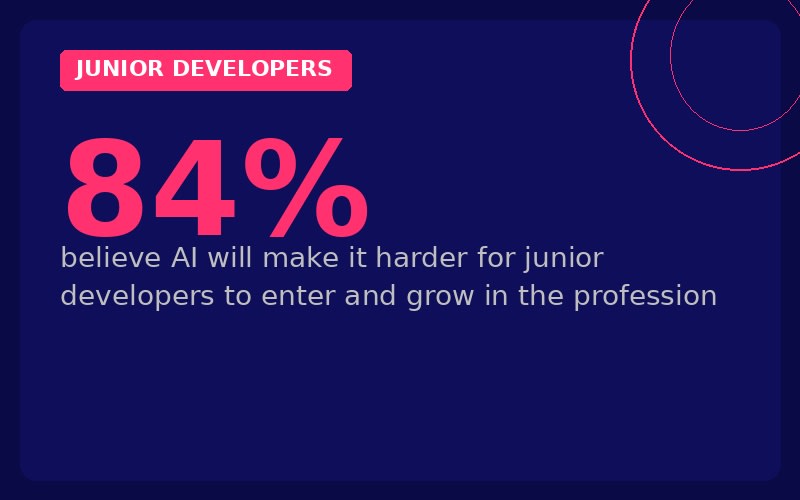
The impact on junior developers is the third most cited concern at 62%, and it is the one with the longest-range implications for the industry.
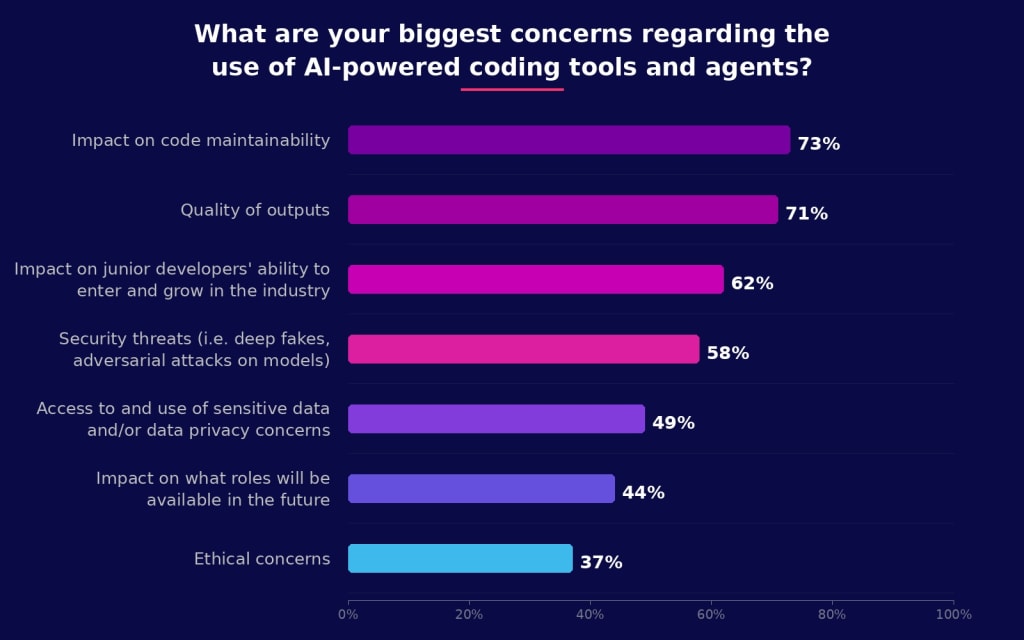
Based on another question, we know that 84% of respondents believe AI-powered tools will generally have a negative impact on junior developers.
Only 4% of respondents cited supporting junior engineers’ development in an AI-assisted world as the primary way AI is affecting their approach to engineering talent.
Just shy of half (49%) say upskilling existing engineers to work effectively with AI is the primary way AI is affecting their talent strategy.

The human cost
of transformation
If the data on organizational change and AI adoption tells the story of external pressures, the data on team health tells the human story of what those pressures are doing to the people inside engineering organizations.
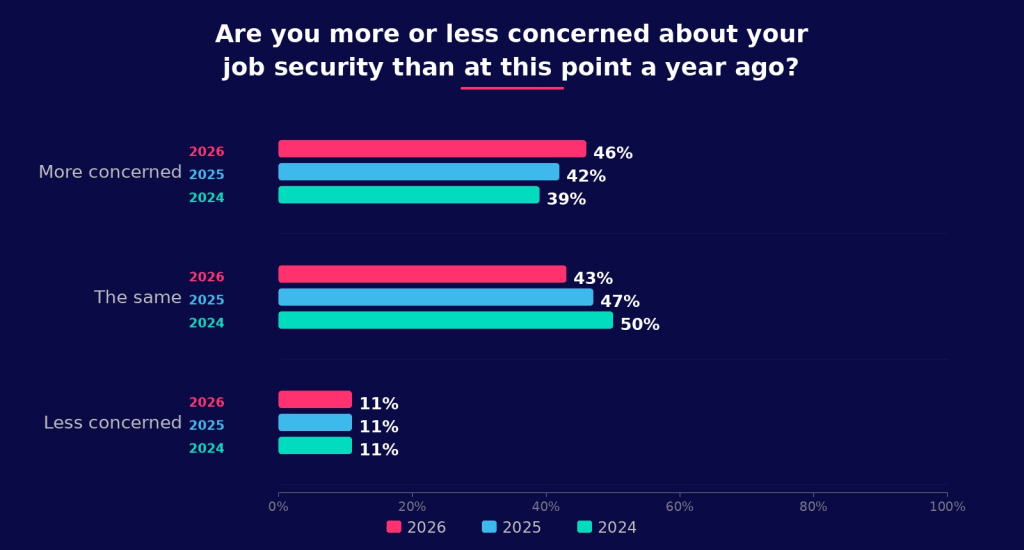
Job security concerns have risen for the third consecutive year, with 46% of respondents more worried than at this point last year, up from 42% in 2025 and 39% in 2024.
Software engineers are most concerned (61%), followed by tech leads (49%) and managers of engineers (46%).
Burnout indicators deserve specific attention.
CTOs show the most dramatic shift: 54% report feeling emotionally drained from their work at least once a week, compared to just 24% in 2025.
“CTOs are burning out because AI has given teams virtually infinite capacity, creating relentless pressure to write highly detailed product specs to ‘feed the beast,’” says Thomas Johnson, CTO at Multiplayer.

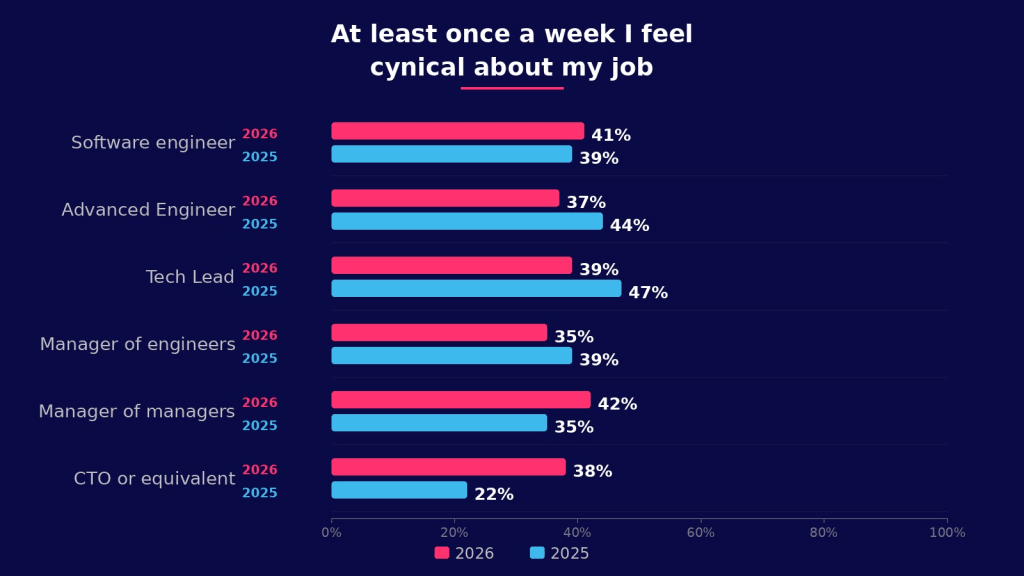
Tech leads show a different but concerning pattern.
Their receipt of regular positive feedback has dropped from 41% to 31%, while cynicism about their jobs is rising.
The people in the middle of the leadership structure and the ones translating strategy into delivery appear to be under particular strain.
What does this mean for engineering leaders?
Engineering leaders are being squeezed from every direction – expanding technical and managerial responsibilities, longer hours, rising anxiety, and fragile team morale.
AI adoption is outpacing the frameworks needed to manage it, and the junior developer pipeline is at risk.
The organizations that navigate this moment won’t be the fastest AI adopters – they’ll be the ones that built trust, clarity, and investment in people.
Most aren’t there yet.

Download the report
Read the full report and get the complete picture of engineering leadership in 2026.